Evaluation & Results
To characterize the analysis steps of targeted conformation capture data and evaluate the performance of different computational methods, we developed Bacon, a benchmark framework. Bacon integrated several ChIA-PET and HiChIP datasets, and provided the fair evaluation for 12 computational methods. We performed the fundamental processing steps for ChIA-PET and HiChIP datasets, including pre-processing, loop calling, and detecting significance of loop interactions.
The output from pre-processing step were uniquely mapped valid PETs in BEDPE format. Bacon used the Uniquely Valid Rate (UV Rate) to evaluate the quality of each wet-lab experiment, the effectiveness of each computational method.
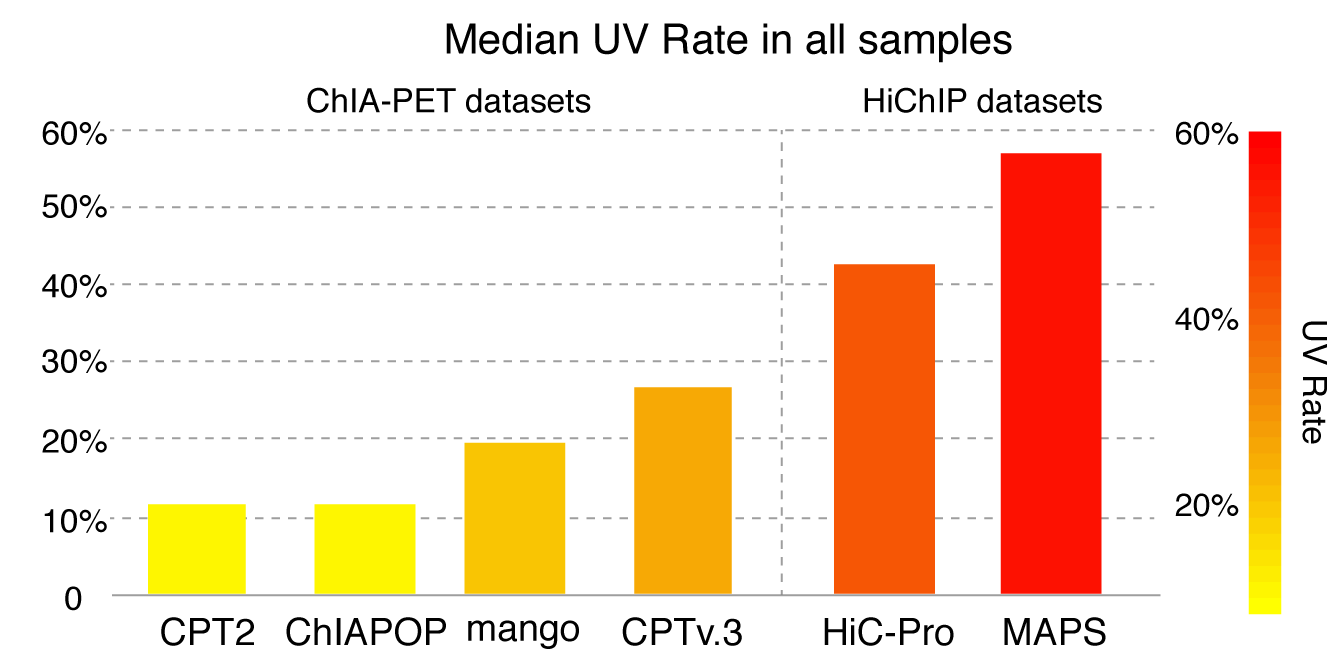
Figure 1. Uniquely mapped Valid PETs Rate (UV Rate) of two groups of comparison datasets.
In calling loops, the two state-of-the-art strategies to identify loops are peak-based and cluster-based. In general, the peak-based methods start this step with peak calling, which implements MACS2 or other peak calling algorithms. Bacon utilized Peak Co-occupancy (PC) to evaluate the accuracy of anchors identified by the peak-based methods. In addition, Bacon evaluated the enrichment levels of cluster-based loops by Enrichment Score (ES).
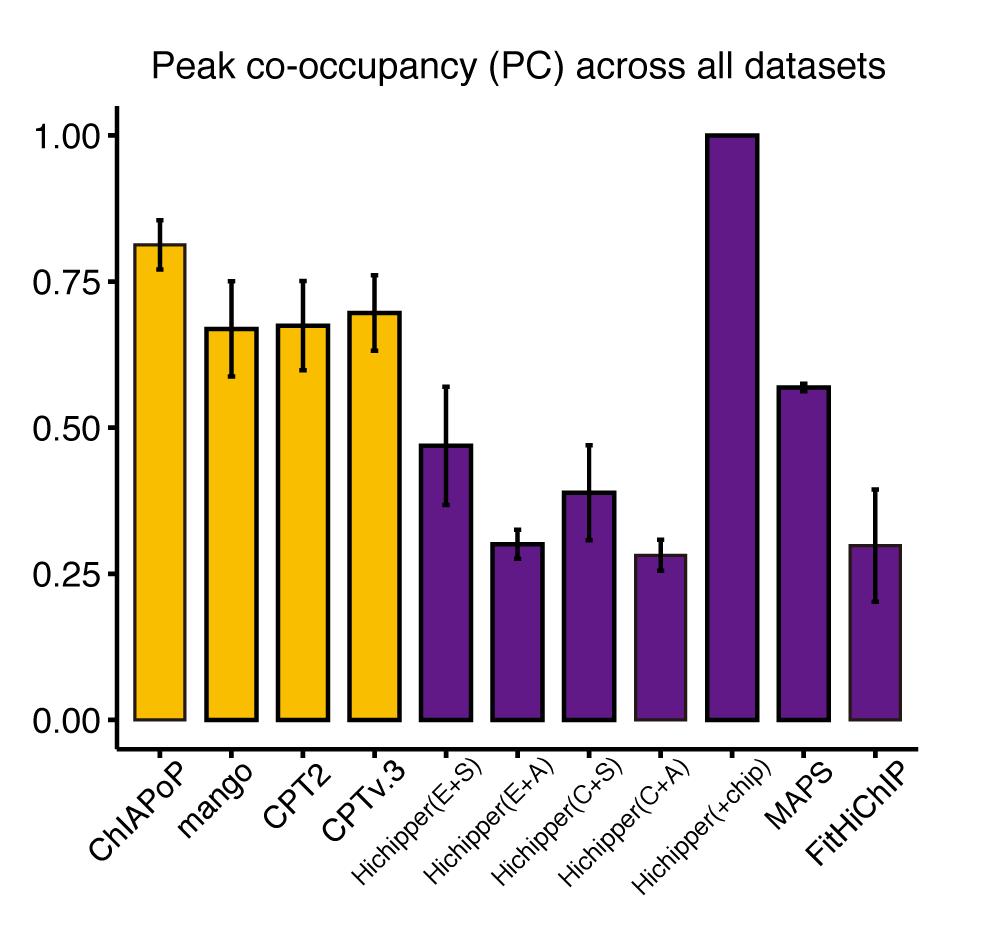
Figure 2. The co-occupancy between loop anchors and ChIP-seq peaks.
To estimate the reliability of cluster-based loop anchors Bacon calculated the enrichment levels of cluster-based loops by Enrichment Score (ES).
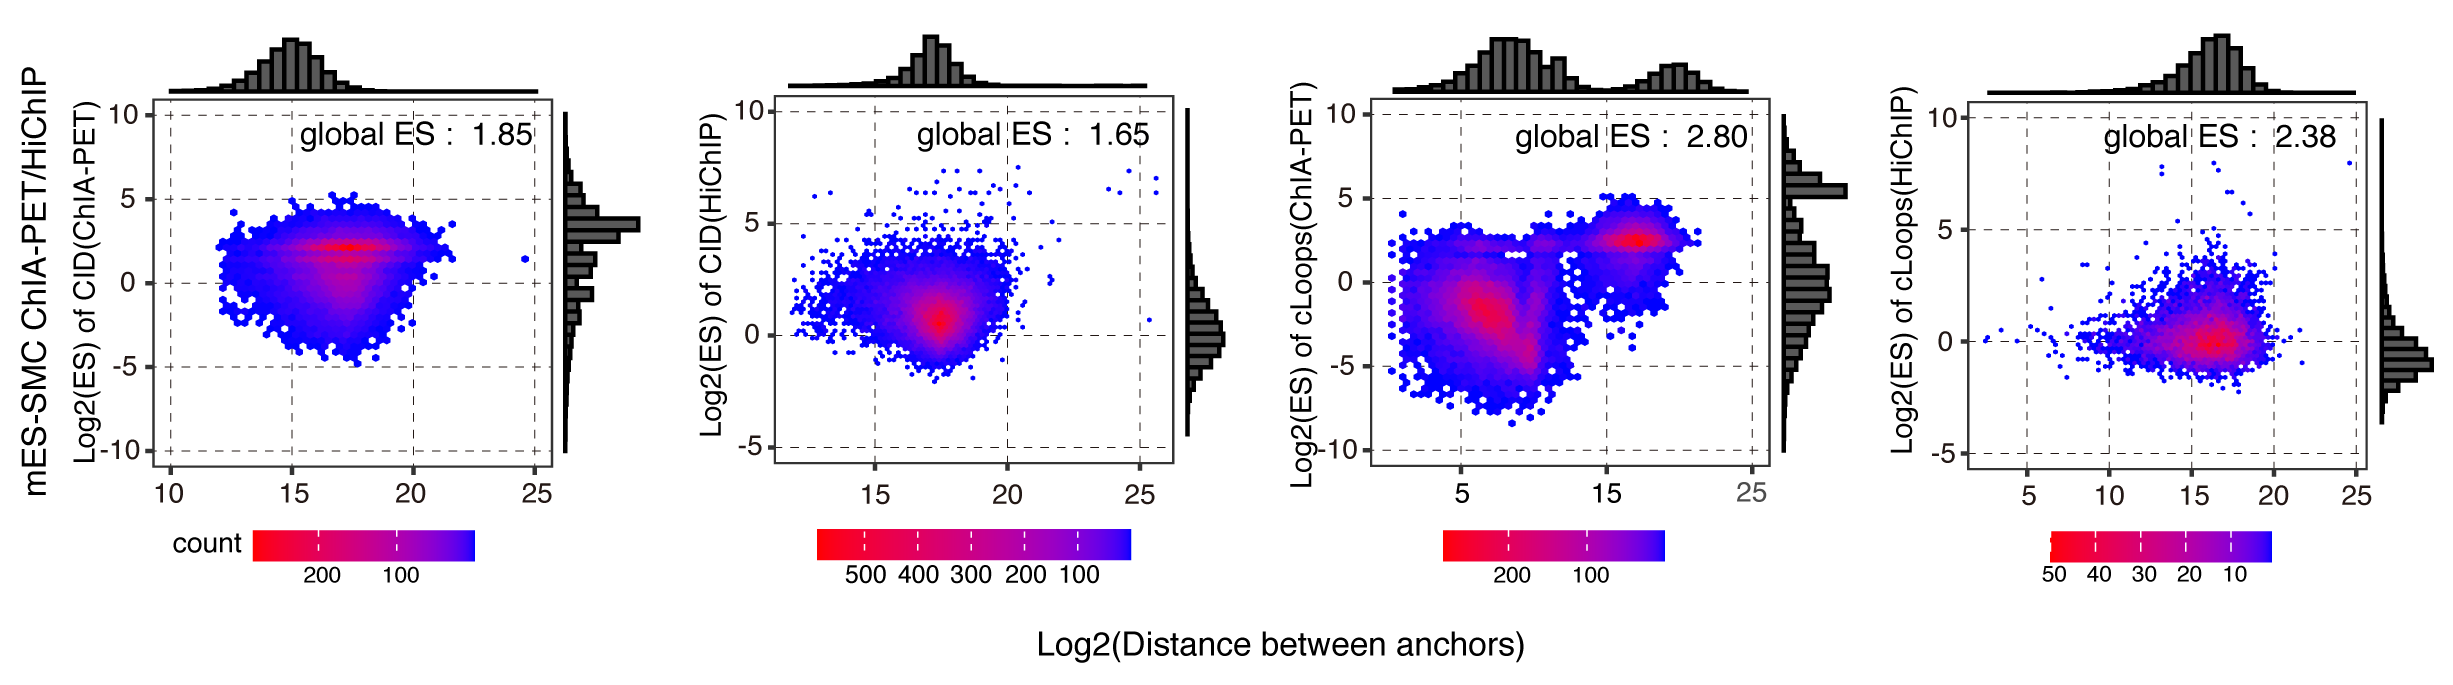
Figure 3. The Hexbin plot showed enrichment score (ES) changed by the distance between anchors. The bar plots on the margin were distributions of ES or distance.
Bacon gathered gold standard interactions from GEUVADIS Project, GTEx Project, CRISPR/Cas9 perturbation, and ENCODE for accuracy (ACC) evaluation.
To determine the properties and to detect the functionality of these significant loops, Bacon utilized candidate enhancer-like and promoter-like signatures from ENCODE to annotate the loops (E-P annotation), the histone marks of H3K27ac, H3K4me1, H3K4me3, and H3K27me3 were used to calculate the Activation Rate (AR) of enhancer-mediated loops.
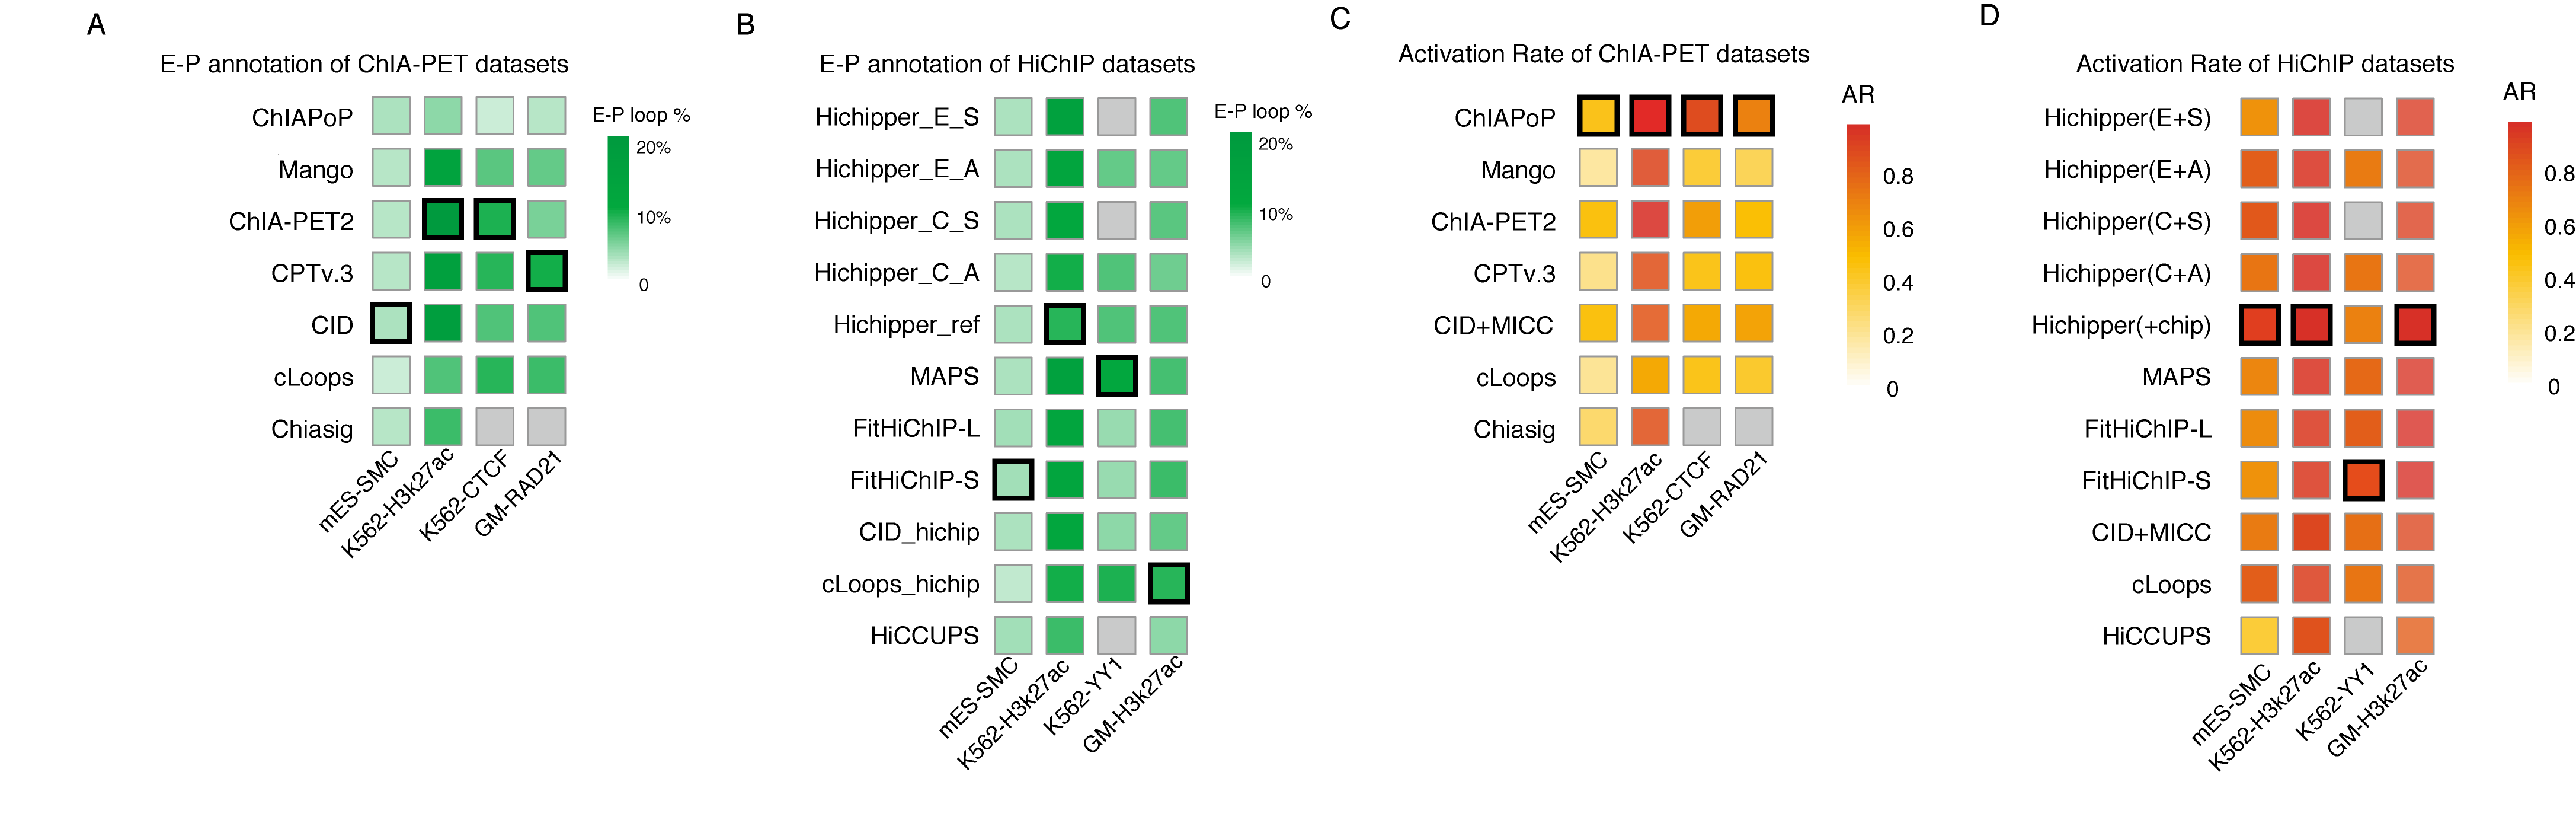
Figure 4. Activation analysis of different tools.
To quantify how well the Hi-C data supported the significant loops, Bacon generates aggregate peak analysis (APA) plots as described in the previsous study. APA plot can be used to evaluate the quality of called loops even when the Hi-C dataset was in a low sequencing depth, APA plot aggregated the signal by pixels which surrounded the loop anchors.

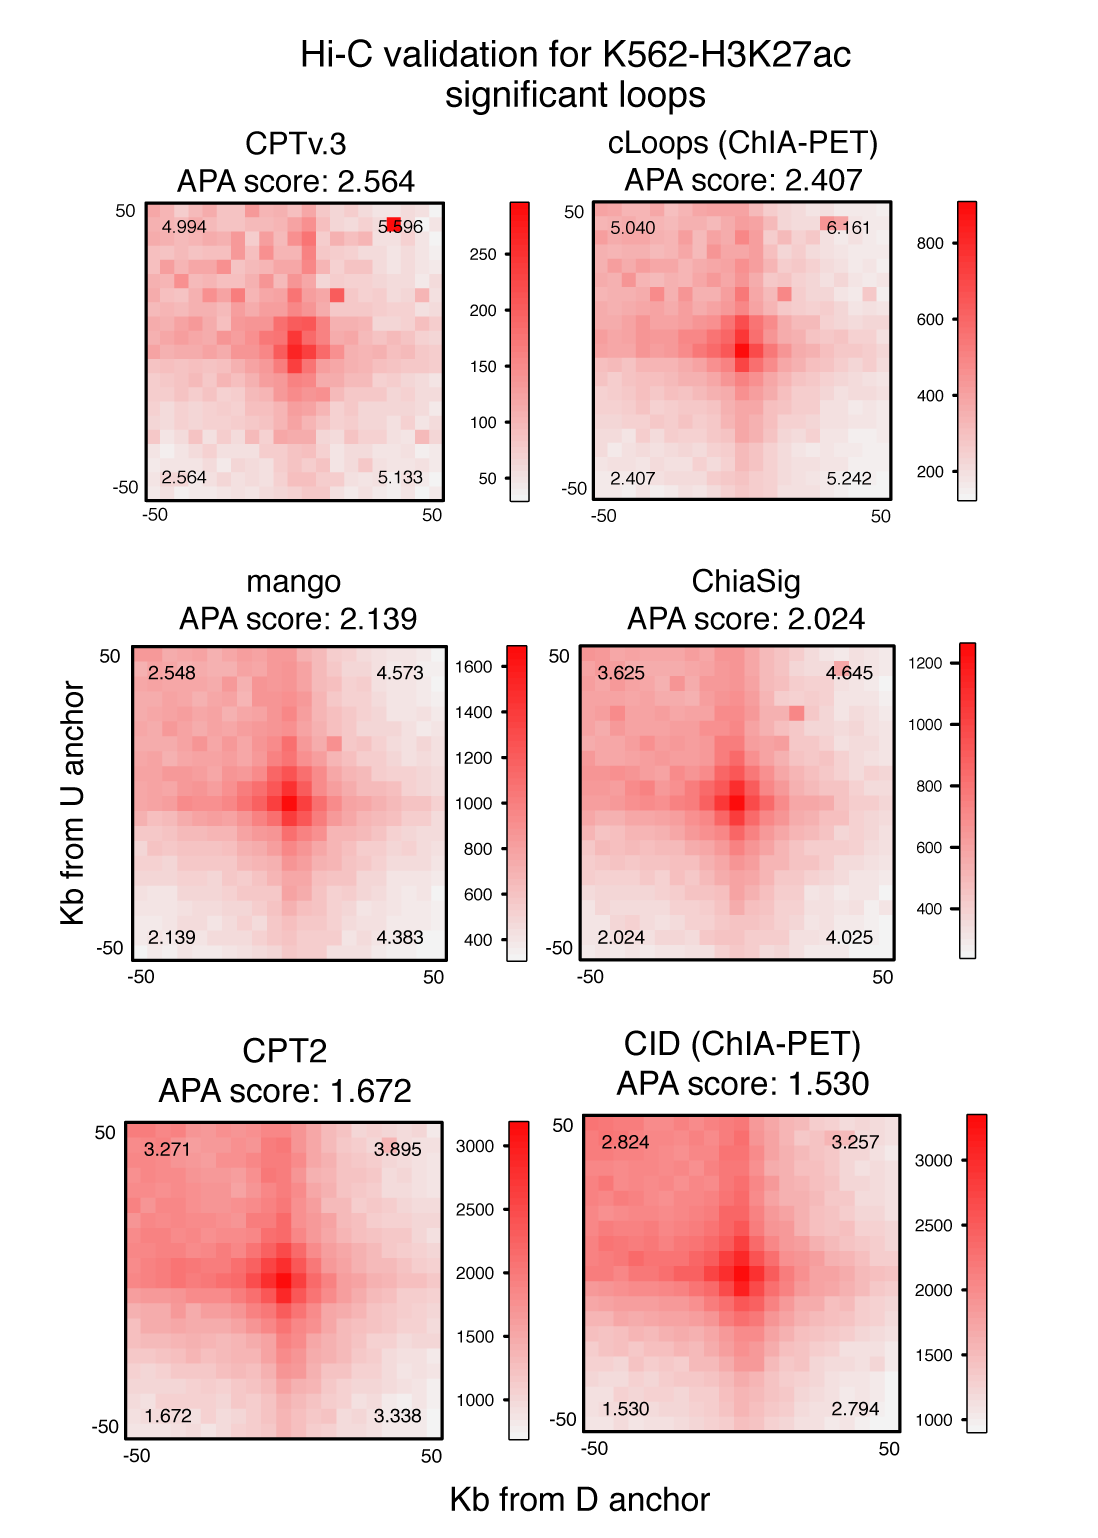
Figure 5. Top Six APA score for two groups of data